In an effort to improve my forensics skills I have been working through publicly available forensics CTFs when I have some free time.
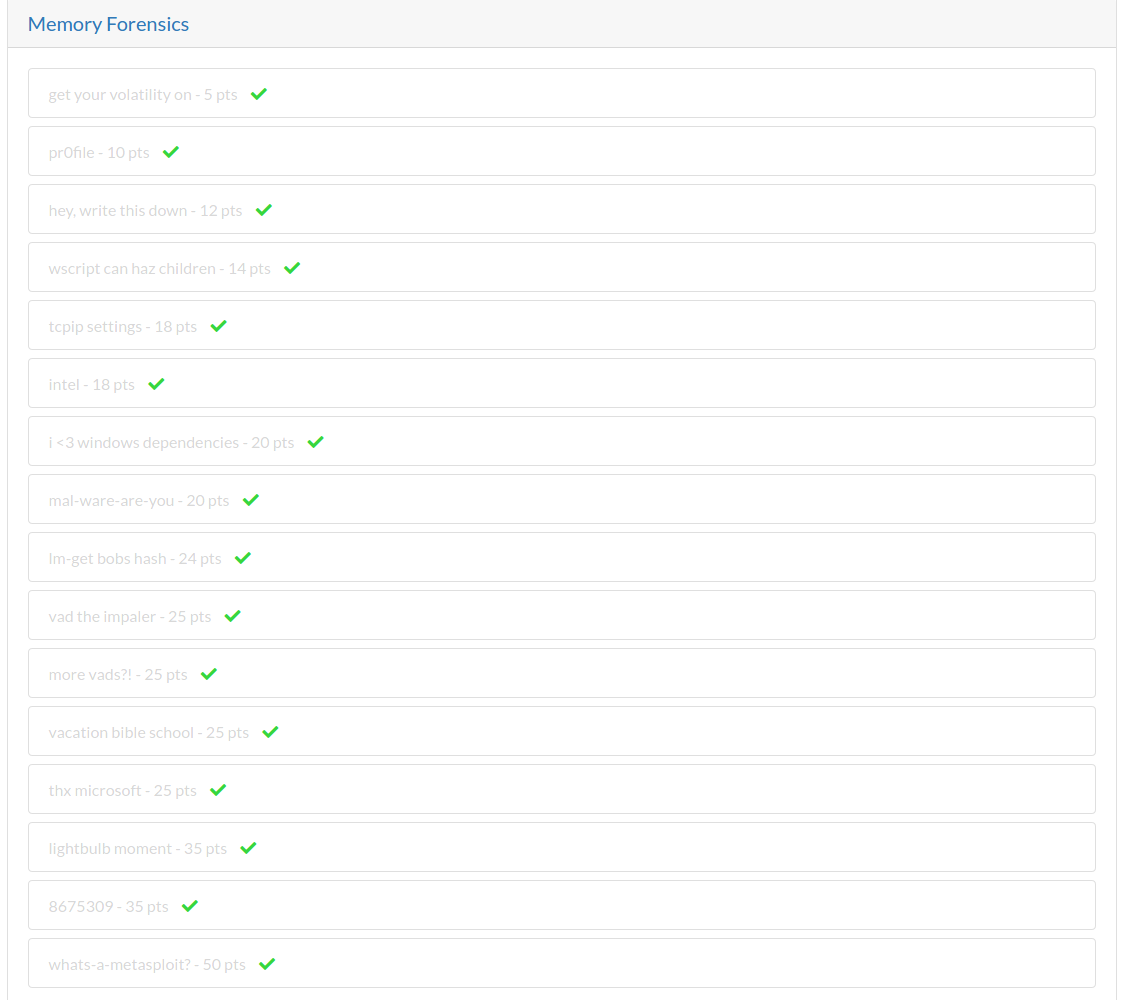
The 2019 Unofficial Defcon DFIR CTF was created by the Champlain College Digital Forensics Association and made public by David Cowen on his Hacking Exposed Computer Forensics blog. The CTF covers Windows and Linux “dead” forensics, a “live” triage VM, memory forensics, and a cryptography challenge. This write-up focuses on the memory forensics questions.
Links to the CTF files and registration/scoreboard can be found on this HECF blog post.
The following MD5 hash was provided for the Triage-Memory.mem file:
MD5: c0c80a06ad336a6e20d42c895a0e067f
Let’s get started!
flag 1 – get your volatility on
We begin with a straightforward one; calculate the SHA1 hash of the memory image.
sha1sum Triage-Memory.mem
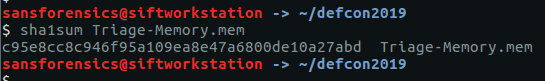
flag<c95e8cc8c946f95a109ea8e47a6800de10a27abd>
flag 2 – pr0file
Again, reasonably simple. We need to work out which profile to use with Volatility to conduct our analysis. The imageinfo plugin will suggest a number of suitable candidates.
vol.py -f Triage-Memory.mem imageinfo
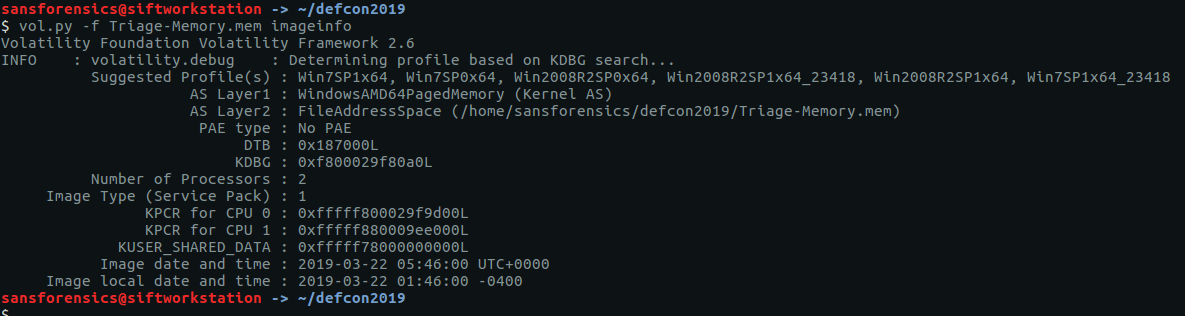
The output lists a few possibilities, but Win7SP1x64 is a sensible choice for now.
flag<Win7SP1x64>
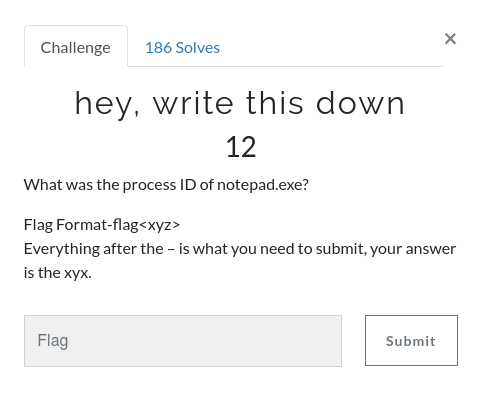
flag 3 – hey, write this down
There are a few Volatility modules we can use to list running process IDs. My personal preference is pstree just because it makes the parent/child relationship more obvious, which can help to spot anything unusual.
vol.py -f Triage-Memory.mem --profile=Win7SP1x64 pstree
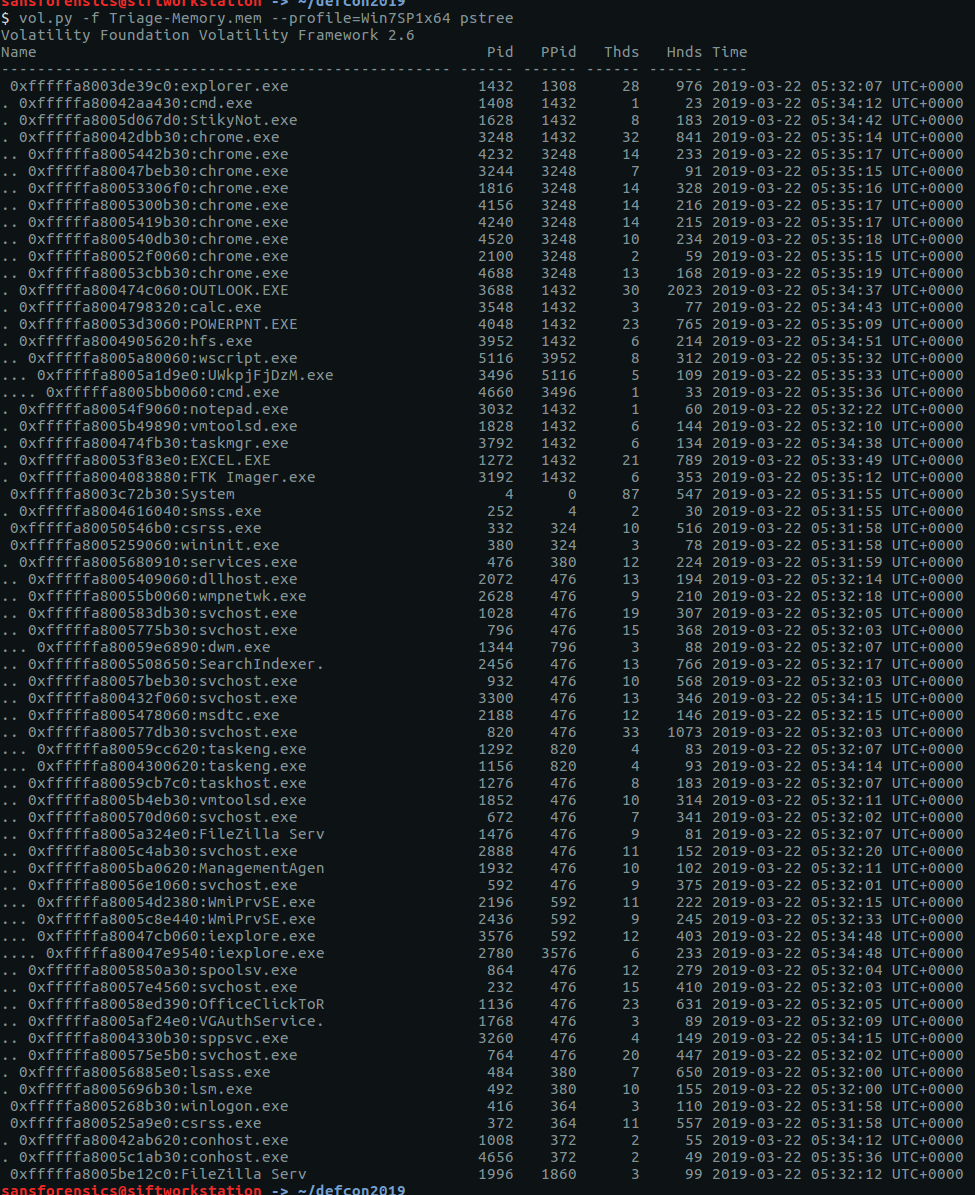
We are looking specifically for notepad.exe so we can cut out a lot of the unrelated output using grep
vol.py -f Triage-Memory.mem --profile=Win7SP1x64 pstree | grep -i "notepad.exe"
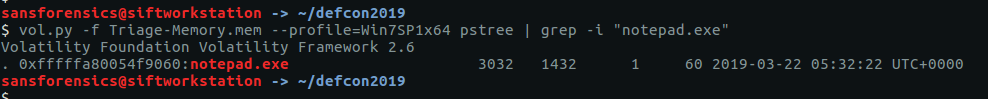
Using grep to filter the output we can easily see that the PID is 3032.
flag<3032>
flag 4 – wscript can haz children
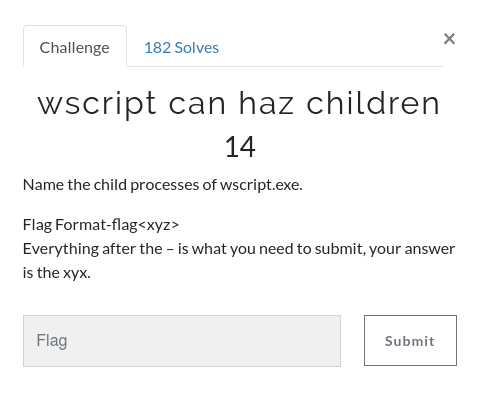
We already have the answer to this from the pstree output in Flag 3, but using grep as a filter will make it easier to spot. The -A 2 option tells grep to display the matching line and the 2 lines that follow it.
vol.py -f Triage-Memory.mem --profile=Win7SP1x64 pstree | grep -A 2 -i "wscript.exe"
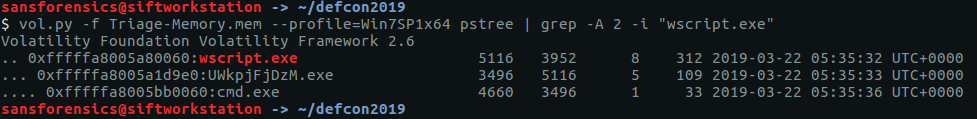
The output shows that wscript.exe has one child process, UWkpjFjDzM.exe, which itself has a child process called cmd.exe; a good indication that something is wrong there.
flag<UWkpjFjDzM.exe>
flag 5 – tcpip settings
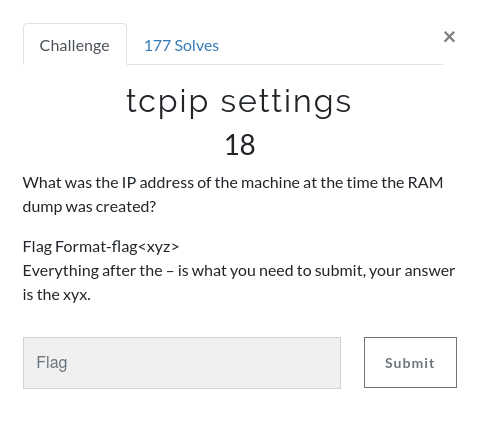
The question asks for the IP address of the machine when the memory dump was taken. The netscan plugin will show details of network artefacts captured in the memory dump.
vol.py -f Triage-Memory.mem --profile=Win7SP1x64 netscan
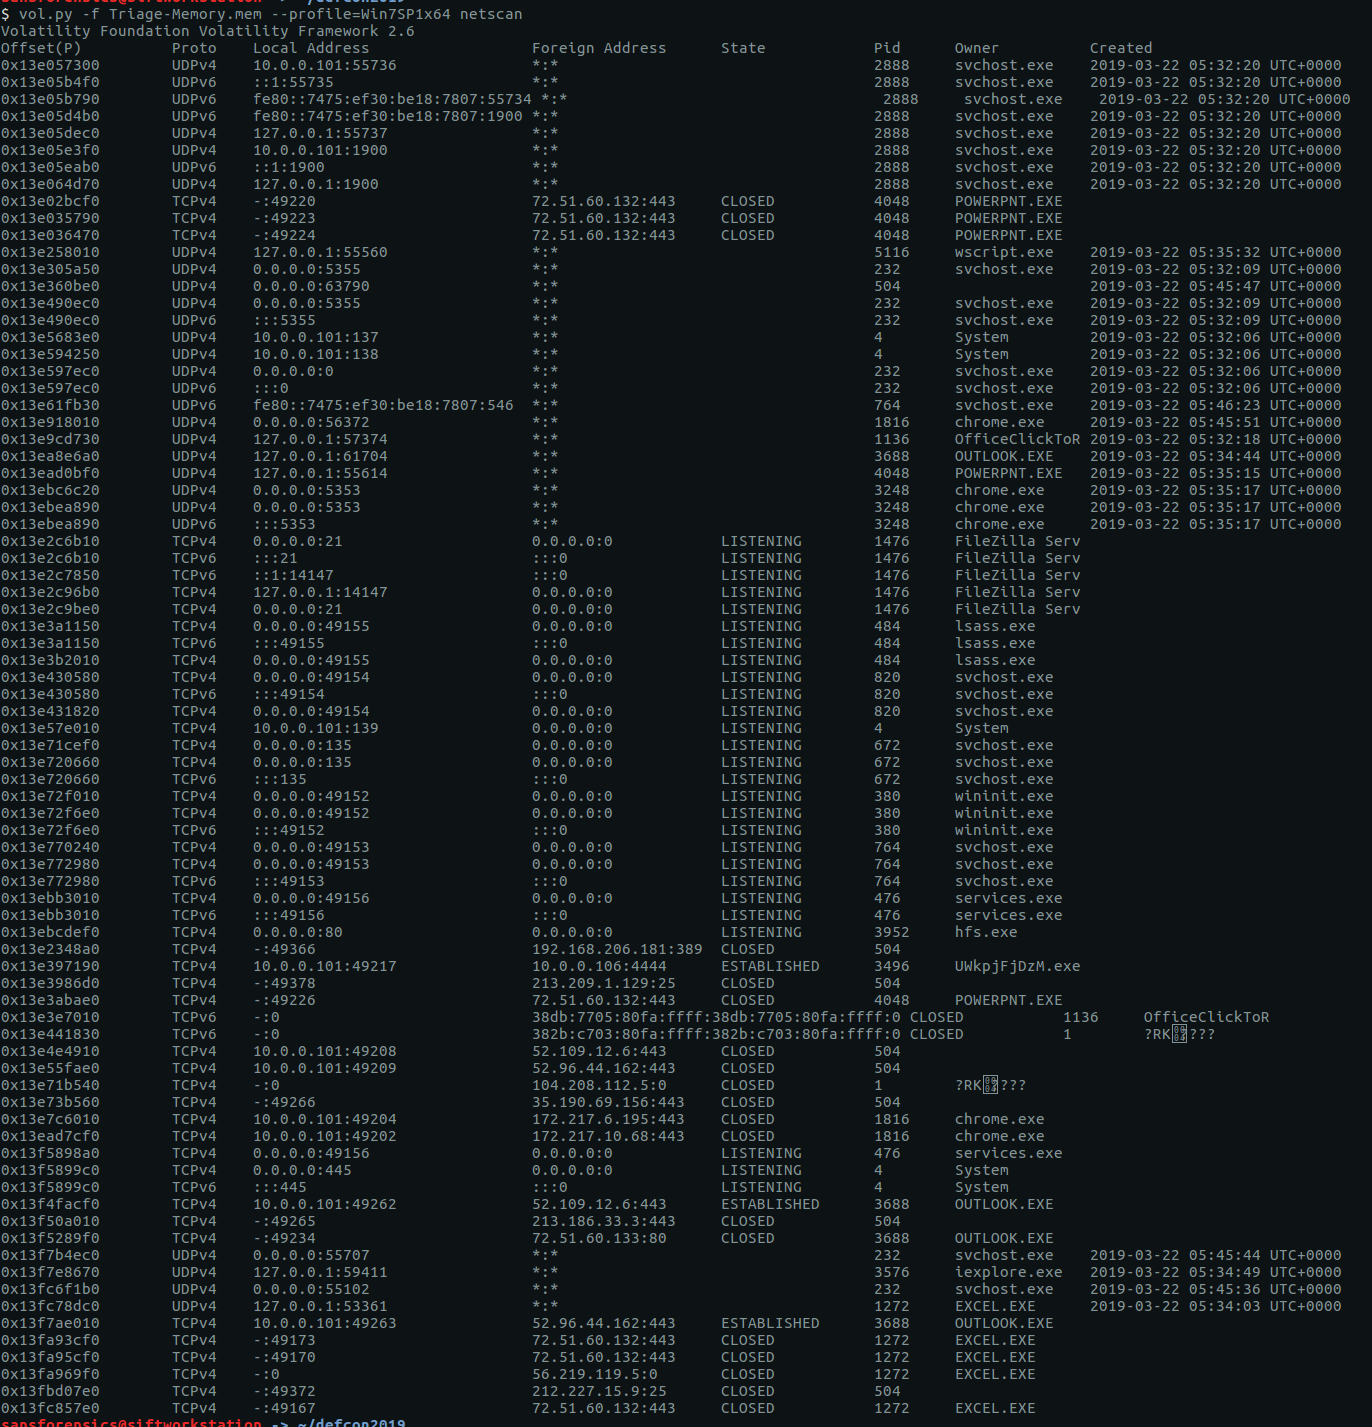
The question asks for the IP address of the machine at the time of the memory dump. We can see processes listening on addresses 0.0.0.0 and 127.0.0.1, which are unlikely to be our flag, and 10.0.0.101 which is a much more likely. Another interesting observation is that our process from Flag 4 is connecting to another machine on port 4444 – the default port for many Metasploit payloads. Keep that in mind for later.
flag<10.0.0.101>
flag 6 – intel
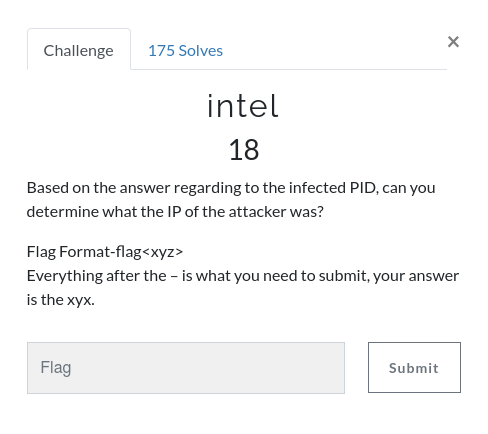 Based on our work to find Flag 4 and Flag 5, we can answer this quite easily. Let’s examine the netscan output more closely.
vol.py -f Triage-Memory.mem --profile=Win7SP1x64 netscan | grep "UWkpjFjDzM.exe"

We can see our “infected” process UWkpjFjDzM.exe connecting to 10.0.0.106 on port 4444.
flag<10.0.0.106>
flag 7 – i <3 windows dependencies
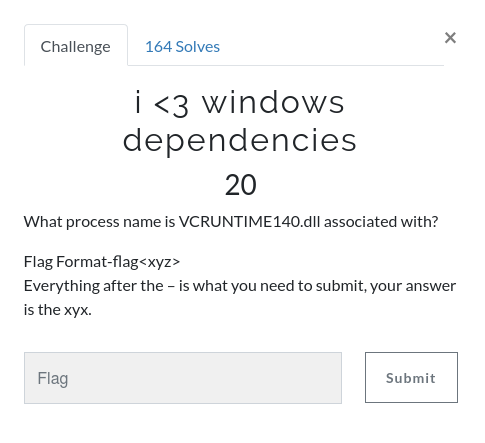
As the name suggests, the dlllist plugin will list the DLLs loaded by each process. This is a lot of output, so to find the answer I used grep with increasing values for the -B option to show the associated process. Not very subtle but it worked!
vol.py -f Triage-Memory.mem --profile=Win7SP1x64 dlllist | grep -B 33 "VCRUNTIME140.dll"
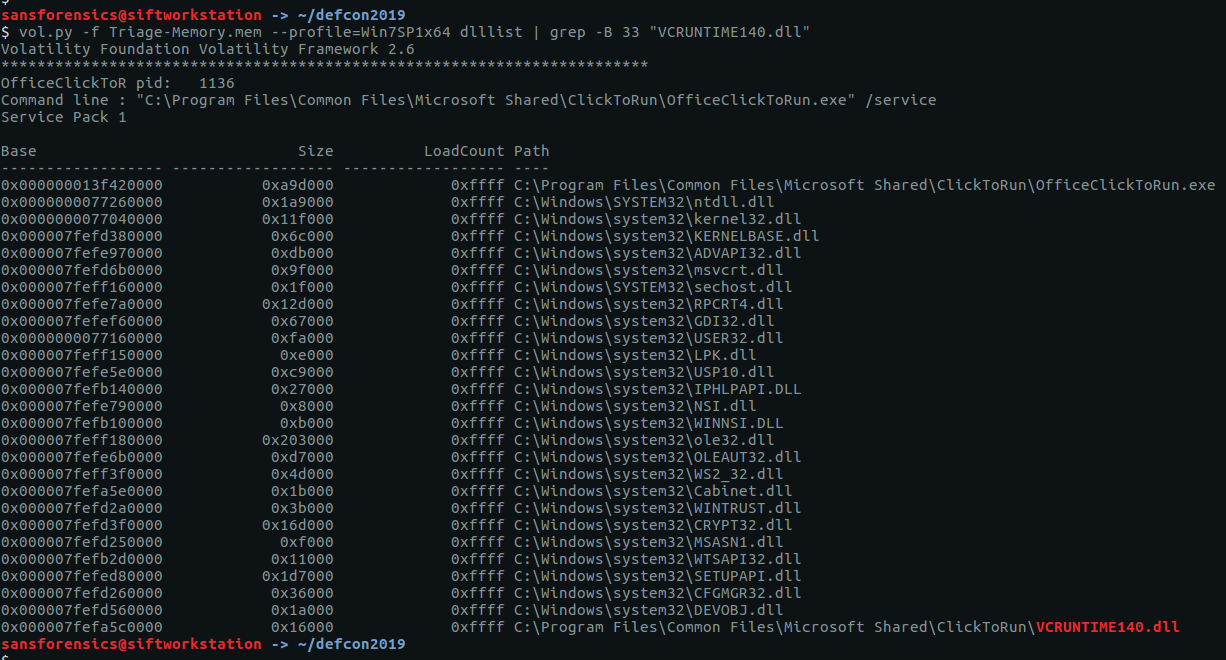
There we are! Initially I submitted OfficeClickToRun.exe as the flag, but when that was rejected I tried the short name (OfficeClickToR) next to the Process ID near the top of the output.
flag<OfficeClickToR>
flag 8 – mal-ware-are-you
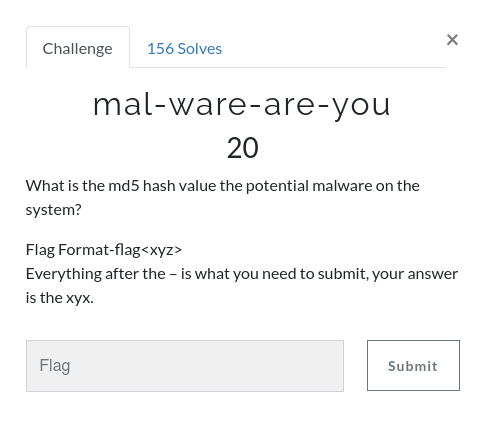
Ok, we have already identified our potential malware from Flags 4, 5, and 6. So take its PID (3496) and dump the executable using the procdump plugin, then calculate the MD5 of the extracted binary.
vol.py -f Triage-Memory.mem --profile=Win7SP1x64 procdump -p 3496 -D .
md5sum executable.3496.exe
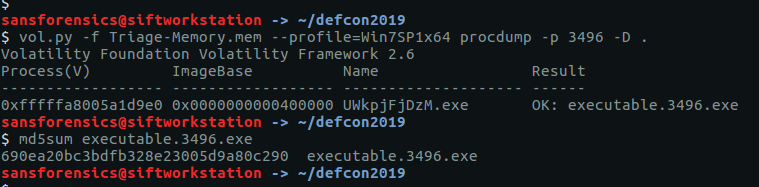
flag<690ea20bc3bdfb328e23005d9a80c290>
flag 9 – lm-get bobs hash
 Another relatively simple one. The hashdump plugin will, predictably, dump the password hashes from memory.
vol.py -f Triage-Memory.mem --profile=Win7SP1x64 hashdump
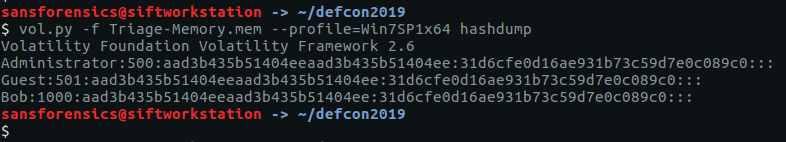
We need to supply the LM hash, which is the first portion of the hash after Bob’s user ID (1000)…
flag<aad3b435b51404eeaad3b435b51404ee>
flag 10 – vad the impaler
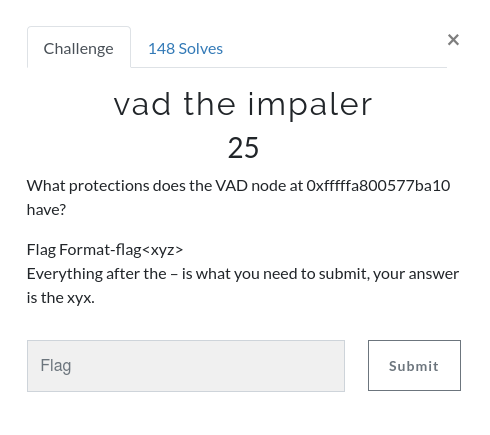
Information on VAD nodes can be extracted using the vadinfo plugin. It outputs a lot of data, so for ease of reading I’ve used grep to focus on the lines we are interested in.
vol.py -f Triage-Memory.mem --profile=Win7SP1x64 vadinfo | grep -A 2 "0xfffffa800577ba10"
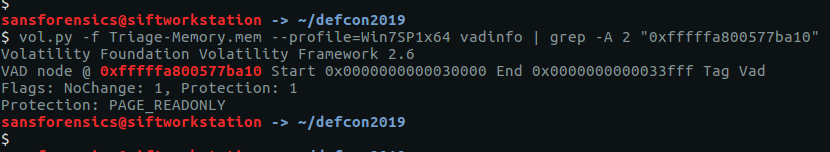
We can see the VAD node at offset 0xfffffa800577ba10 has the PAGE_READONLY protection. That’s our flag.
flag<PAGE_READONLY>
11 – more vads?!
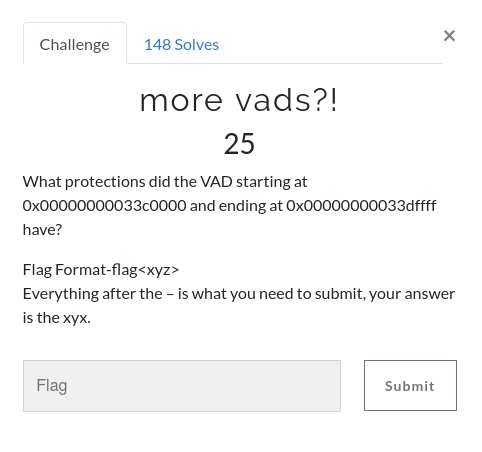
This is essentially the same question as Flag 10, just with a bit of extra grep. Instead of filtering on the starting offset, we filter on both start and end.
vol.py -f Triage-Memory.mem --profile=Win7SP1x64 vadinfo | grep -A 2 "Start 0x00000000033c0000 End 0x00000000033dffff"
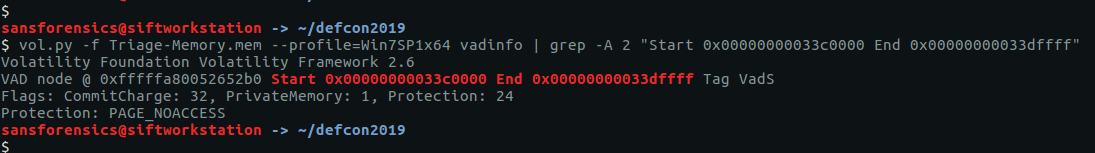
This time the protection is PAGE_NOACCESS.
flag<PAGE_NOACCESS>
flag 12 – vacation bible school
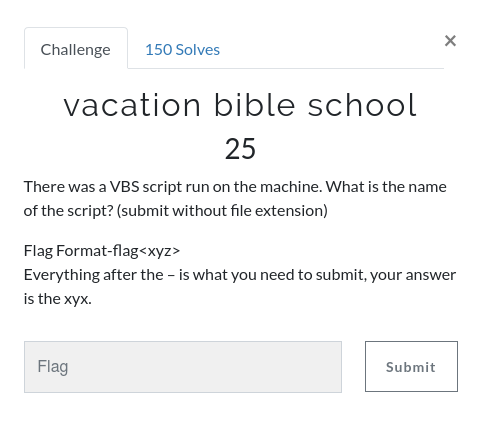
We are looking for a VBS script now. There are a few ways we could do this but the easiest is simply to check the command-line used to start the wscript.exe process that we observed in the pstree output for Flag 4. We know the wscript.exe PID is 5116, so we can pass that to the cmdline plugin to reduce the reading we have to do.
vol.py -f Triage-Memory.mem --profile=Win7SP1x64 cmdline -p 5116
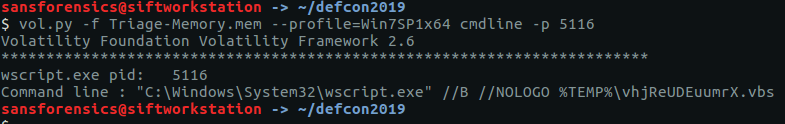
We can see that wscript.exe was called with a script called vhjReUDEuumrX.vbs from the %TEMP% directory. Strip the extension and we have our flag.
flag<vhjReUDEuumrX>
flag 13 – thx microsoft
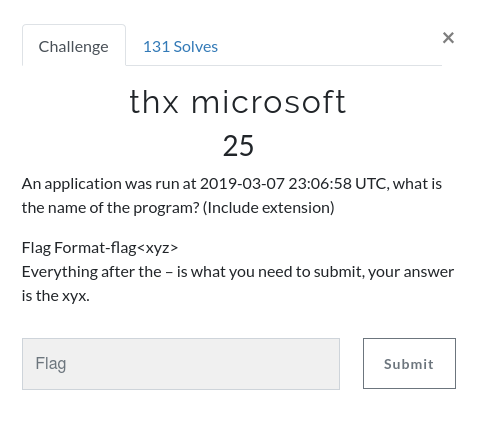
The Application Compatibility Cache (or shimcache) contains details of program execution and can be parsed using the shimcache plugin. We are looking for an application executed at a specified date and time, so we can use grep to filter the output.
vol.py -f Triage-Memory.mem --profile=Win7SP1x64 shimcache | grep "2019-03-07 23:06:58"
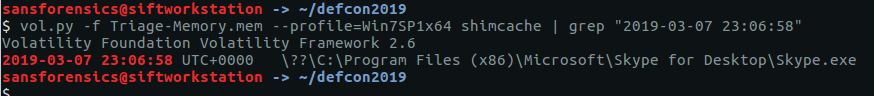
This time we need to include the file extension.
flag<Skype.exe>
flag 14 – lightbulb moment

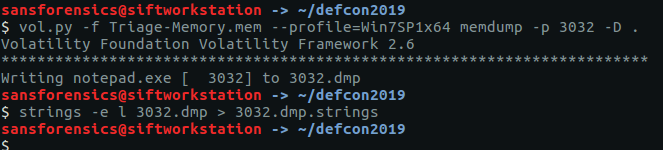
Extracting the text from a running notepad.exe process is relatively straightforward but does require a couple of steps. First we need to dump the process memory using the memdump plugin; we found the PID for notepad.exe in Flag 3 (3032). The next step is to use the strings utility to extract all of the human-readable little-endian strings and write them to a file.
vol.py -f Triage-Memory.mem --profile=Win7SP1x64 memdump -p 3032 -D .
strings -e l 3032.dmp > 3032.dmp.strings
Once we have our strings output we can use grep to search for our flag. The word “flag” seems a reasonable place to start.
grep "flag" 3032.dmp.strings
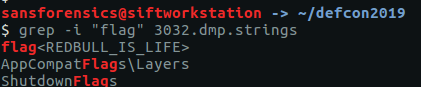
There we go!
flag<REDBULL_IS_LIFE>
flag 15 – 8675309
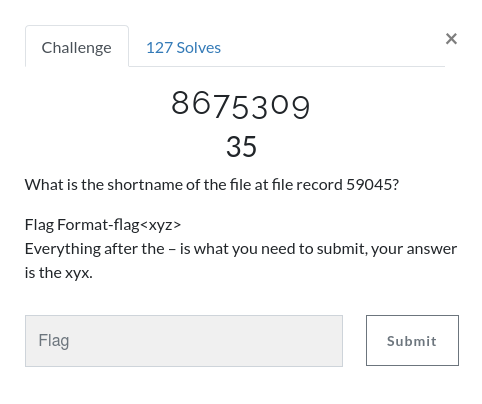
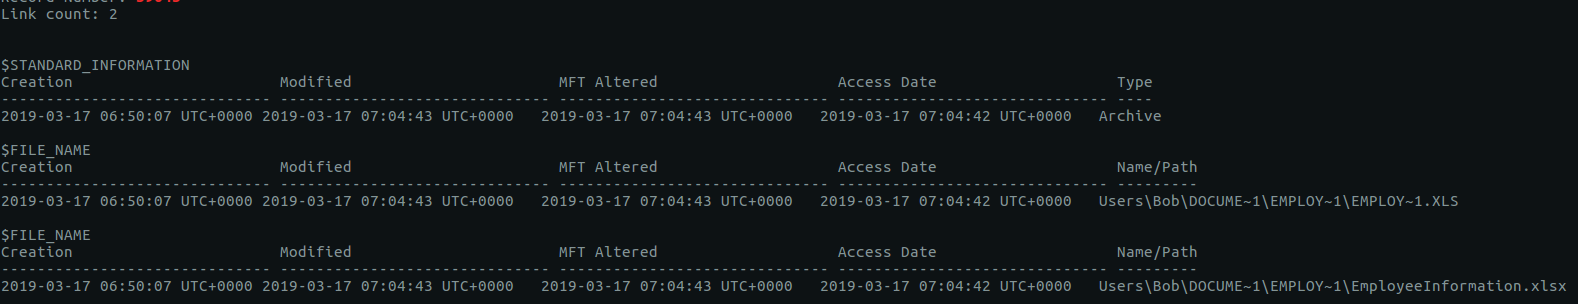
Details about file records are held in the Master File Table (MFT) and can be extracted from the memory dump using the mftparser plugin. We are specifically looking for the Short Name of the file at record 59045; once again, grep will help us here.
vol.py -f Triage-Memory.mem --profile=Win7SP1x64 mftparser | grep -A 20 "59045"
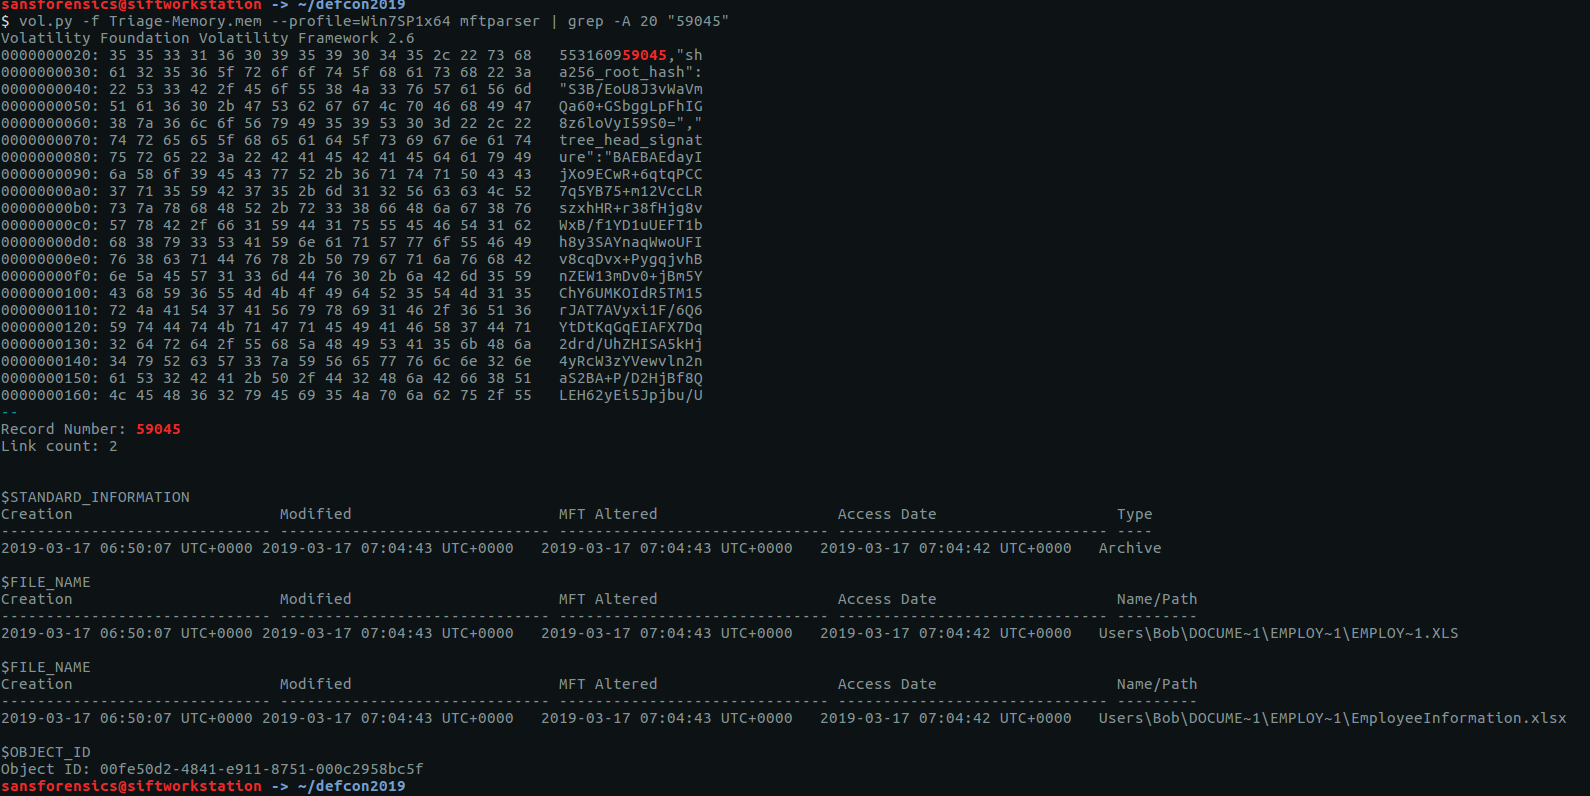
Reading through the output we can see the 8.3 short file name EMPLOY~1.XLS.
flag<EMPLOY~1.XLS>
flag 16 – whats-a-metasploit?
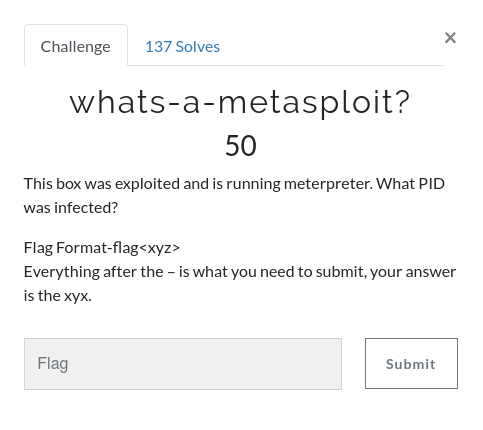
We can be pretty sure that UWkpjFjDzM.exe (PID: 3496) is our Meterpreter process, given what we found out answering Flag 4, 5, and 6, but let’s make sure. First we dump the process executable using the procdump module, then calculate its SHA1 hash so we can search public sandboxes like VirusTotal.
vol.py -f Triage-Memory.mem --profile=Win7SP1x64 procdump -p 3496 -D .
sha1sum executable.3496.exe
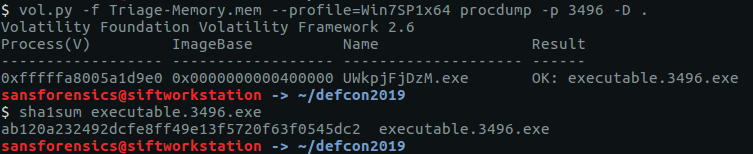
Searching VirusTotal for the SHA1 hash (ab120a232492dcfe8ff49e13f5720f63f0545dc2) gives us a report clearly showing that the sample is malicious.
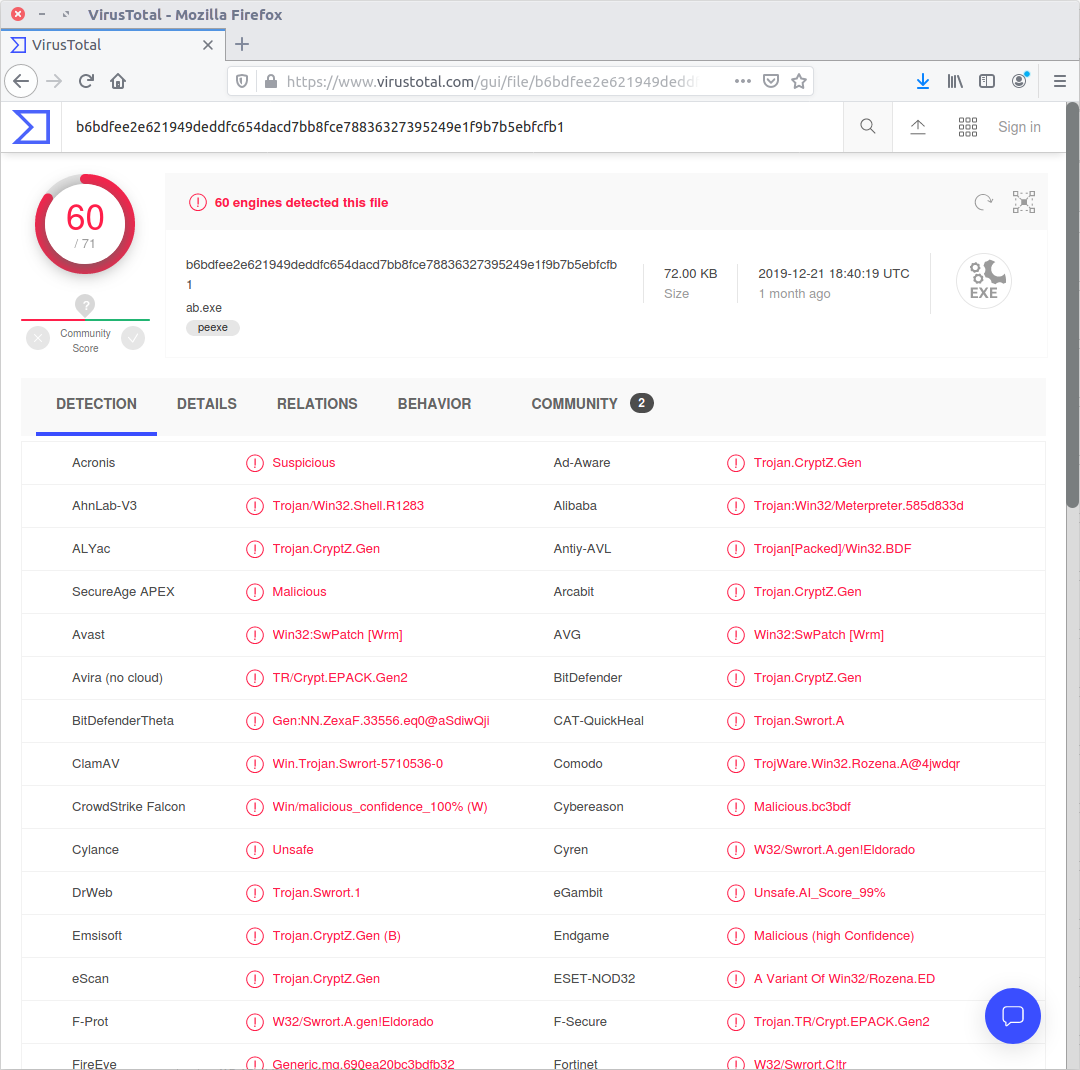
We submit the process ID (3496) and we have completed the memory analysis section!
flag<3496>
This is a really well put together set of challenges, and when I have more time I will probably return to take on the Windows and Linux challenges as well.
Hi there,
Thanks for the detailed writeup. Really enjoyed reading through the article.
I was unable to understand the explanation provided for Flag 5. Could you explain on why the specific IP address was selected for RAM Dump?
Ps : Is there any clue.