Enabling Switch Configuration in OpenWRT Luci on Linksys WRT1900ACS

Since I installed ProxMox on my HP Microserver I’ve been meaning to build an isolated lab network rather than having vulnerable VMs in my main environment. My Microserver has two physical interfaces so my plan was to split one of the ports on my router off onto its own VLAN and bind my lab VMs to that.

VLAN configuration in OpenWRT isn’t quite as straightforward as I’d hoped so being able to use the web-based interface to do this would be nice.

Sadly, the “Switch” configuration wasn’t available by default but after a bit of searching I found this OpenWRT forum thread with the answer!

By adding the following snippet to /etc/config/network and rebooting the router, the Switch config tab will be available in Luci:

config switch
        option name 'switch0'
        option reset '1'
        option enable_vlan '1'

config switch_vlan
        option device 'switch0'
        option vlan '1'
        option ports '0 1 2 3 6'

config switch_vlan
        option device 'switch0'
        option vlan '2'
        option ports '4 5'


Proxmox & Software RAID5 on HP Microserver Gen8

I recently bought a HP Microserver Gen8 with the intention of installing Proxmox and expanding my virtual lab environment. In my setup, Proxmox is installed and boots from the internal Micro-SD card reader, with 4 2TB spinning disks (actually 3x2TB & 1X3TB, due to a shipping error in my favour!) to hold the virtual machines. The built-in hardware RAID controller lacks decent Linux drivers so I used software RAID instead of the HP Smart Provisioning utility.

The setup wasn’t particularly difficult, but wasn’t particularly obvious either. This post is a rough guide to the process as I will almost certainly need to rebuild this thing at some point in the future! As Proxmox is Debian-based the Digital Ocean documentation was very useful.

First, disable the built-in RAID controller and have it operate as a standard SATA one instead.

  1. Boot into Setup (F9)
  2. System Options -> SATA Controller Options -> Embedded SATA Configuration -> Enable SATA AHCI Support

Reboot into Proxmox and update/upgrade the OS packages:

apt-get update && apt-get upgrade -y
apt-get dist-upgrade

Install mdadm. As Proxmox is installed on the SD card, there is no need to start the array before the OS boots, so enter “none” when prompted:

apt-get install mdadm

View the raw devices and build the RAID:

lsblk -o NAME,SIZE,FSTYPE,TYPE,MOUNTPOINT
mdadm –create –verbose /dev/md0 –level=5 –raid-devices=4 /dev/sda /dev/sdb /dev/sdc /dev/sdd

This will take a few hours; progress can be checked:

cat /proc/mdstat

Once the array is built, create the filesystem, create a mount point, and mount the RAID:

mkfs.ext4 -F /dev/md0
mkdir -p /mnt/md0
mount /dev/md0 /mnt/md0

Confirm that the RAID is available:

df -h -x devtmpfs -x tmpfs

Save the array layout, update initramfs, and automatically mount the array at boot:

mdadm –detail –scan | tee -a /etc/mdadm/mdadm.conf
update-initramfs -u
echo ‘/dev/md0 /mnt/md0 ext4 defaults,nofail,discard 0 0’ | tee -a /etc/fstab

The RAID is now ready for data. One tip a friend gave me (a little too late, unfortunately) was to check the logical identifiers for each disk and physically label each one so that when one fails, finding and replacing it will be easier.

Making Sense of 10010 OnionScan Results

A few months ago, Sarah Jamie Lewis released the wonderful OnionScan; a tool for enumerating (and resolving) potential security issues arising from poorly configured Tor Hidden Services. It’s kind of a big deal for people who are interested in that sort of thing.

As cool as OnionScan is, scanning Hidden Services one at a time tends to become rather tedious. Fortunately, Justin Seitz wrote up a nice tutorial on automating OnionScan through a Python wrapper, and being one of those people who are interested in that sort of thing, I set it all up on a dedicated server and left it to run for a few days.

Using Justin’s initial list of 8592 Hidden Services as a starting point, I ended up with 10010 completed scans (which was good) and 10010 distinct JSON files containing the results (which was not so good). “There’s bound to be something interesting in there”, I thought. I could get a rough idea of the state of things by grepping the results files for JSON entries, and even tried throwing EyeWitness at the web and VNC services, but still didn’t really get anywhere. What I really needed was some kind of database.

Introducing onionscan2db…

OnionScan can write its results out to machine-readable JSON files, so parsing them is fairly straightforward. I used Python for no other reason than I like it, and SQLite3 because it’s simple and Python supports it without the need for any additional modules.

The code is probably best described as “functional”. It’s not particularly pretty and there’s definitely room for speeding up the database writes, but it’ll take a take more than 10000 JSON formatted OnionScan results and build an SQLite database that can then be used to do something useful.

onionscan2db

The tool is available from GitHub and can be run from the following command

python onionscan2db -d <onionscan-results-directory> -o <output-database>

I’ll try to keep it updated in line with OnionScan, but the code is relatively modular and it shouldn’t be too difficult for anyone else to improve the database structure and import functions as necessary.

CREST Registered Intrusion Analyst

A little while ago I took (and passed) the CREST Registered Intrusion Analyst exam. This post won’t give anything away in terms of the exam itself, but hopefully will serve as a bit of background for anyone who happens to be thinking about trying for the certification, as I found information a bit lacking when I was preparing for it.

I’m not sure the CRIA certification is particularly well recognised. I only knew about CREST’s pen testing certs before, and none of my friends who still focus on forensics had even heard of it. In summary, CRIA is an entry level certification which covers aspects of network traffic analysis, host-based forensics, malware analysis, and briefly touches upon relevant laws and professional standards. The exam itself is split into a closed-book written multiple-choice paper and a longer open-book (but effectively no internet access) practical exam, which again, uses a multiple choice format.

CREST provide so little information on what kind of topics will be covered that it’s easy to become a bit overwhelmed when trying to prepare (a complaint I hear a lot about CREST’s other exams). Remember that it’s an entry level certification – think “a mile wide, but an inch deep”. The suggested reading list is a great example of this lack of context:

Reading Material:
Hacking Exposed – Scanning and Enumeration
The Art of Memory Forensics:  Detecting Malware and Threats in Windows, Linux, and Mac Memory (by Michael Hale Ligh/Andrew Case/Jamie Levy/Aaron Walters)
Malware Forensic Field Guide for Windows Systems (by Syngress)
Practical Malware Analysis
Network Fundamentals: CCNA Exploration Companion Guide
Real Digital Forensics (particularly chapter 1, Windows Live Response)
TCP/IP Illustrated

TCP/IP Illustrated? Really? It’s three bloody volumes! While I’ve read at least parts of most of the suggested books, I didn’t pay a great deal of attention to CREST’s list. Instead, I’ve listed a few books I found helpful and included chapters where I could:

  • Red Team Field Manual (it’s just a good resource to have anyway)
  • Real Digital Forensics (Chapter 1, Windows Live Response)
  • Practical Packet Analysis
  • Practical Malware Analysis (Part 1, Basic Analysis)
  • Windows Forensic Analysis Toolkit, 3rd Edition

Another thing to consider is CREST’s policy of retaining your hard drive and wiping it before returning it. Rather than go through the hassle of imaging my day-to-day work laptop I used a spare one and just installed Kali linux on it. This was fine for the majority of the exam, but I realised I tend to use a lot of Windows tools when doing malware analysis in particular. Kali has equivalents for everything you’re likely to need, though in my case it meant frantically scanning the man pages for the right command-line switches!

In all, I didn’t find the exam particularly difficult but the wide scope of the material was a little daunting. The more specialised follow-up certifications look a bit more interesting and actually strike me as being easier to prepare for, as at least they limit the scope of material to network traffic, malware, or host-based analysis.

Thoughts on Running a Tor Exit Node for a Year

I’m a big fan of Tor. Both as a concept in that it allows people to access information that might otherwise be inaccessible*, and as an interesting technical project. In an effort to support the Tor network and to learn more about how it actually works, I’ve been hosting various Tor nodes on various boxes for a few years now but around this time last year I stepped things up a bit and began running an Exit node that has consistently ranked in the top 100 world-wide in terms of usable bandwidth.

When I mention this to people I tend to get the same questions, so I thought it best to write the answers here, and maybe save a few people (including myself) some time.

Do you need special hardware?

No, not really. The Tor daemon doesn’t really take advantage multi-core CPUs, so in most cases throwing extra processing power at it won’t give you much of an advantage. I rent a relatively low-end physical server (Celeron G530, 2GB RAM) but I found the biggest limitation to be affordable bandwidth. I have an uncapped 100MBit/s line to my server – not blisteringly fast but it’s saturated almost 100% of the time. In a typical month my Exit will shift somewhere around 35TB of traffic, combined upstream and down.

graph

What do your hosting company think about that?

They’re ok with it! Not all hosting companies are though so if you’re thinking of running any kind of Tor node make sure to check first. I’m in the UK, my hosting company are not. Depending on where you, your hosting company, and their data centre are geographically it’s unlikely to be illegal to run a node, but there’s a good chance it will be against the hosting companies T&C’s, particularly in the case of Exit nodes.

The Tor Project wiki holds a pretty comprehensive list of good and bad hosting companies and ISPs.

What about abuse reports?

There will be abuse reports. Learn to deal with them – ignoring them altogether is usually a good way to get on the bad side of your hosting company. There are things you can do to cut down on the number of abuse reports you receive; the most effective in my experience is to configure a reduced exit policy, blocking ports commonly used for things like SMTP and BitTorrent**. It’s not perfect, but it has dramatically cut the number reports I have to deal with – I tend to get about 1 a week on average now.

Can I run a Tor node from home?

You can, but it’s really best not to. That’s especially true for Exit nodes. For one thing, your home broadband connection is probably not fast enough to contribute any meaningful bandwidth. Second, the IP addresses of all Tor Relay (Middle node) and Exit nodes are publicly available, and as a straightforward way of cutting down on the sort of abuse I described above, more and more online services are just blocking all those IP addresses outright. It’s not very subtle but it does work! So you can run a Relay or an Exit from home, but you’ll probably find that sooner or later Netflix will stop working. Your call.

A better option for those who want to contribute to Tor from a home connection is running a Bridge node, or donating directly to an organisation like TorServers.net.

Aren’t you worried about the Police/GCHQ/Mossad/3PLA/etc?

Not especially, I’ve certainly never had any legal troubles because of Tor. By it’s very nature though traffic from a system like Tor is likely to be more interesting than the rest of the internet as far as a nation-state is concerned, and with only about 1000 Exit nodes running, monitoring all of them is well within the capabilities of a reasonably funded SIGINT agency. I assume my Exit (along with all the rest of them) is being monitored, if not actively targeted. Other than hardening the box as far as possible there’s not much more that can be done against an adversary like that. Who knows, maybe one day I’ll end up with some fun malware to analyse.


* I’ve done a lot of forensics work in my time and been exposed to all kinds of Bad Stuff as a result. I am by no means naive enough to suggest that systems like Tor don’t help people access Bad Stuff, but I think on balance the positive uses outweigh the bad ones.

** BitTorrent over Tor is a bad idea in general. Firstly, it doesn’t give you any anonymity. And second, it slows the network down for everyone else. I block common BitTorrent ports on my exits. Don’t like it? Run your own.

Making Sense of 2,027,189 Login Attempts

Back in January I began setting up a Kippo SSH honeypot on an old VPS that I wasn’t really using for anything else. As it was a spur-of-the-moment kind of thing I spent an hour or two making the Kippo SSH service look a bit more interesting (and less like Kippo) before hardening the real SSH service and promptly forgetting all about it.

Until last week when I logged into the VPS for the first time in close to six months, noticed a suspiciously large number of SSH connections, and after a brief moment of panic, realised I had six months of honeypot data to play with! The excitement didn’t last very long.

Kippo Graph

There’s quite a lot of 3rd party development around Kippo, and one of the really nice projects is kippo-graph. Kippo-graph was written by @ikoniaris and is a collection of (mostly) PHP files which extract data from Kippo’s MySQL database, and generate and display lots of nice graphs, charts, and statistics showing what’s been happening on the honeypot. It’s exactly what I needed! The only problem was that in my haste to get Kippo up and running I’d forgotten to enable MySQL logging…

6,732 Text Files

kippo-files

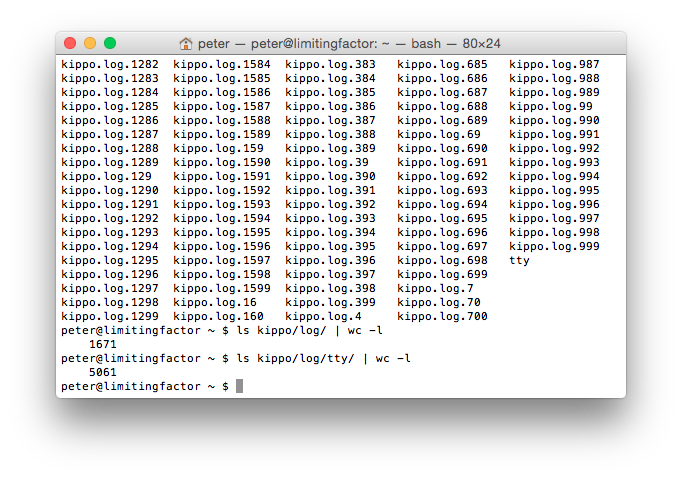
Instead of a nice database I was left with roughly 6,700 text files detailing every IP address, password attempt, and console command issued over a six month period. Analysing them manually obviously wasn’t going to work, so my only other option was to parse the text files and build the database myself. While I could probably have taken a few days to throw something together in Python, a bit of searching pointed me at Ion’s blog about kippo-log2db. I was getting closer.

Kippo-log2db

Kippo-log2db is a Perl script by Jim Clausing (@jclausing) that parses the Kippo log files and creates a MySQL database following the original Kippo schema. After downloading the script and giving it the correct MySQL credentials, my initial attempts were met with a couple of recurring errors:

DBD::mysql::st fetchrow_array failed: fetch() without execute() at ./kippo-log2db.pl line 98,

and

DBD::mysql::st execute failed: Column ‘sensor’ cannot be null at ./kippo-log2db.pl line 125,

The first of these errors appears to be due to the script trying to reference an empty set of results pulled from an earlier MySQL query. I’m not a Perl coder, and the script was adding records to the database, so I just let that one go. The second error was more concerning, referencing a database error as a result of trying to insert a null value into the “sensor” column. My main concern was that this indicated my logs were incomplete, or otherwise lacking values, but being too impatient to go digging through the log files I simply modified the database schema to allow null values in the “sessions” table. This is likely to have caused a few problems later on.

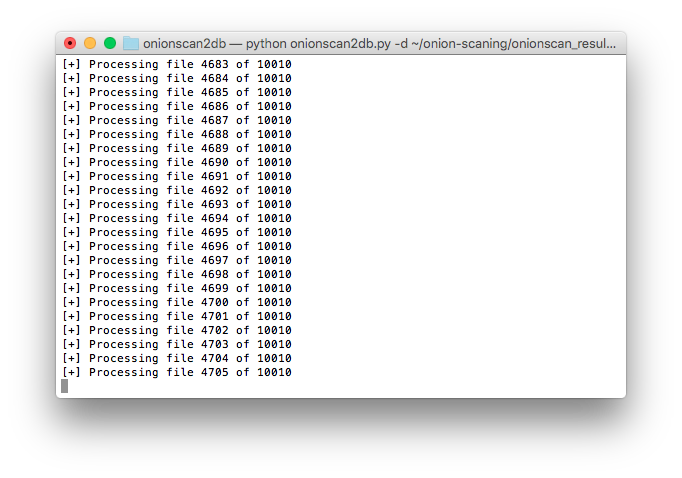
“This could take some time to complete”

Following the modifications I restarted the script and left it to run. Jim warns in his script that it might take some time; he’s not joking. I originally used an old 256MB Raspberry Pi to run the import but after running it overnight and seeing it had only completed 200 of the 1,600 log files, I moved the data to one of my dedicated boxes and restarted the process, even so, the import took a little over 3 days to complete but left me with the nice database I needed.

I quickly downloaded and configured kippo-graph, then fired up a web browser to see what it made of my efforts.

kippo-stats

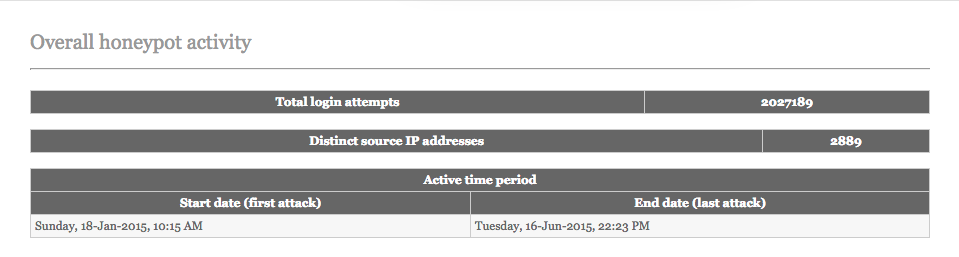
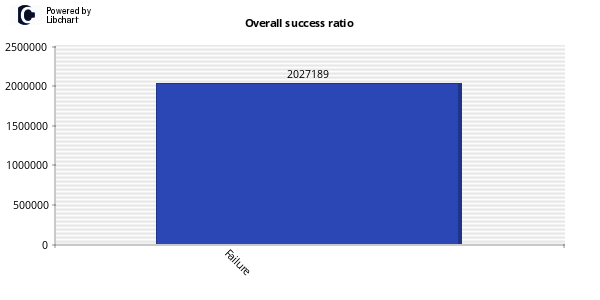
2,027,189 login attempts! The errors I encountered during the database creation seem to have propagated through in places. For example, kippo-graph seems to think that every single login attempt failed.

success_ratioOther charts are more useful though, and the kippo-input and kippo-playlog functions are simply brilliant. The process didn’t work perfectly, but well enough that I should be able to get something interesting out of my data.

Of course, this could all have been avoided if I’d remembered to enable MySQL logging in the first place!

Forensic Analysis of the Nintendo Wii Game Console

By popular* demand… my MSc thesis from 2010. Still, as far as I’m aware, the most complete analysis of the original Nintendo Wii console. Possibly for good reason!

Abstract

Like other modern game consoles, the Nintendo Wii provides users with a powerful networked device capable of performing many of the tasks carried out by a conventional desktop personal computer. Unlike other modern game consoles however, the Nintendo Wii utilises an internal NAND flash storage device in lieu of a standard hard disk drive, and thus cannot be imaged in the same manner as the Microsoft Xbox or Sony Playstation 3. The difficulties in imaging the device are exacerbated by the tightly-controlled, proprietary nature of the platform, and have led to forensic examiners being faced with the choice of ignoring the Nintendo Wii completely, or performing a live examination and potentially destroying evidence.

Through a series of experiments, investigates the feasibility of a number of hardware and software procedures designed to capture the raw data held by the Nintendo Wii’s NAND flash storage device so that conventional digital forensic techniques may be applied to the console. In addition to the successful capture of data, this report also describes a process by which the console can be restored to a previously-captured state, reducing the risks associated with performing a live examination. Also described is the analysis of the captured NAND flash image, which has demonstrated the recovery of a partial history of internet usage and sent Wii Message Board communications – information which was previously thought to be inaccessible by any other means.

Link: Forensic Analysis of the Nintendo Wii Game Console
SHA1: 376de01c8e404cd6674199c19c20b7cb456355d3
MD5: 24ec2d5cc539d3f7d2dc7168b077af77