At the beginning of March 2020 Richard Davis published a small memory forensics CTF challenge to his 13Cubed Youtube channel, with four questions and the generous prize of a Nintendo Switch Lite for a randomly selected entrant with all four correct flags. Well, I didn’t win, but I did have a lot of fun digging into the memory image. And as Richard has published his official solution I thought I’d show my working as well.
We start off as usual by downloading the memory dump and calculating some hashes.
MD5: f3cc405eaf4e63cb9c4b4986c86a7016
SHA1: 7d2b7802b87da03c5e96f159d0bc7ba29896a07c
Before we can dig any deeper into the image we need to tell Volatility which profile to use by running the imageinfo plugin.
vol.py -f memdump.mem imageinfo

We are offered a few possibilities but Win10x64_17134 seems sensible enough for now. On with the challenge!
Flag 1
Find the running rogue (malicious) process. The flag is the MD5 hash of its PID.
There are a few different plugins which will show us information about processes; my favourite is pstree as it makes spotting parent/child relationships much easier.
vol.py -f memdump.mem --profile=Win10x64_17134 pstree
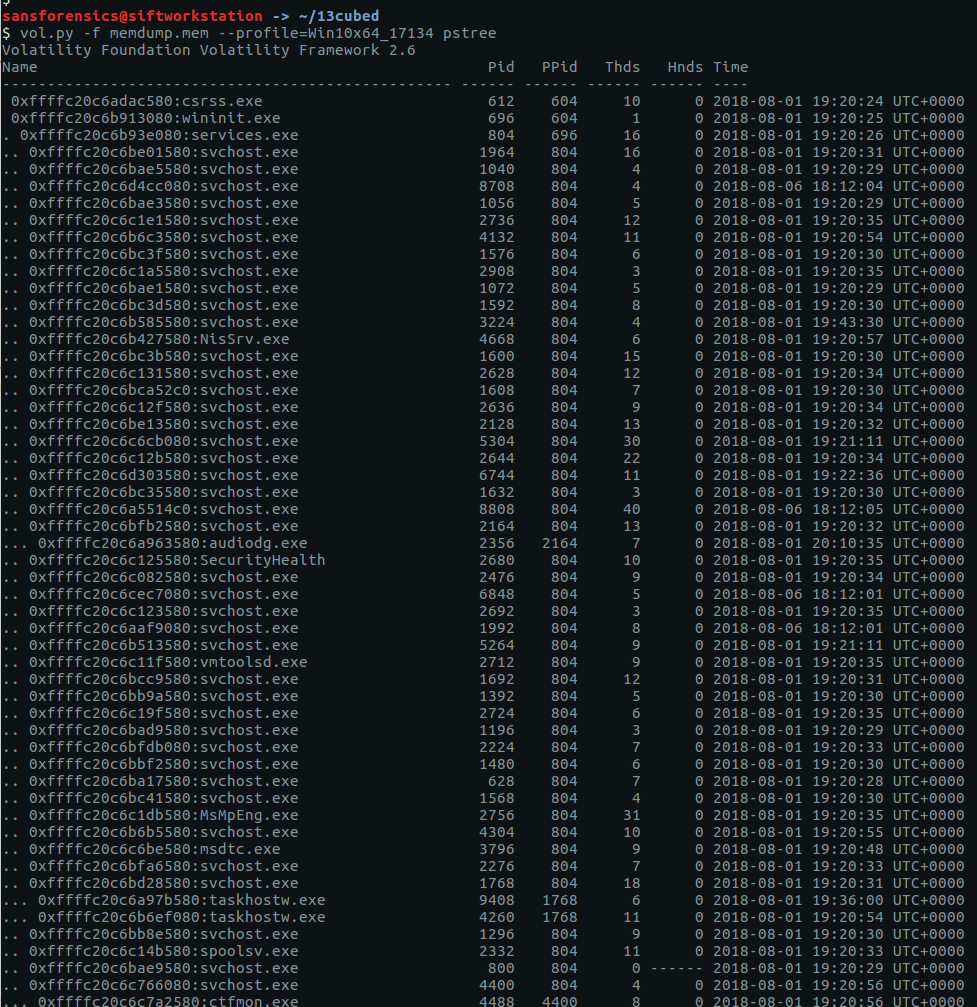
We have a lot of running processes! Things get more interesting after scrolling down a bit further.
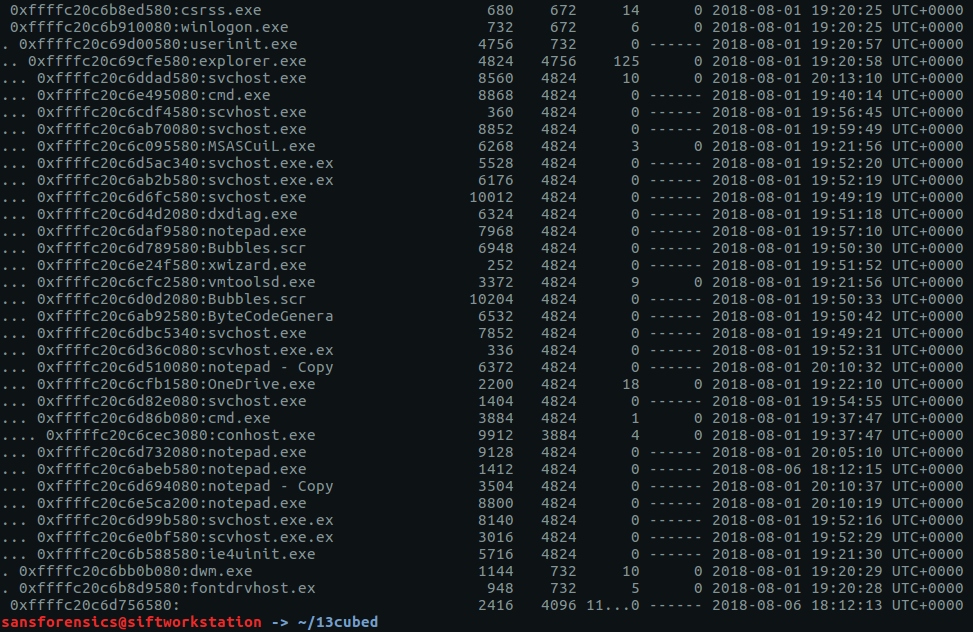
There are a number of processes named svchost.exe running under explorer.exe – this should never happen with a legitimate svchost.exe process! Let’s dig a bit deeper with pstree, using grep to show the column headers, and filter out the svchost.exe processes with a Parent Process ID of 4824 (explorer.exe)
vol.py -f memdump.mem --profile=Win10x64_17134 pstree | grep -E "^Name|svchost" | grep -E "^Name|4824"
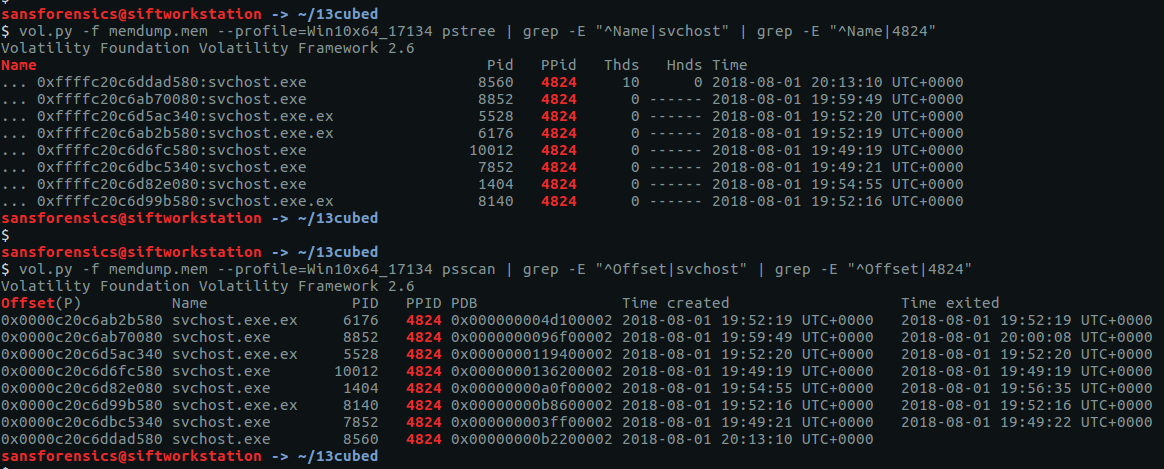
The question specified a running process; 8560 looks a likely candidate given it is the only one that has any threads attached, but let’s use the psscan plugin to confirm.
vol.py -f memdump.mem --profile=Win10x64_17134 psscan | grep -E "^Offset|svchost" | grep -E "^Offset|4824"
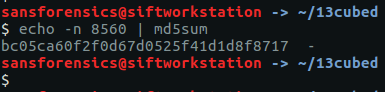
As the screenshot above shows, all the candidate process have an exit time except for 8560, suggesting it is our running rogue process. Calculate the MD5 hash of the PID and we have our first flag.
echo -n 8560 | md5sum
bc05ca60f2f0d67d0525f41d1d8f8717
Flag 2
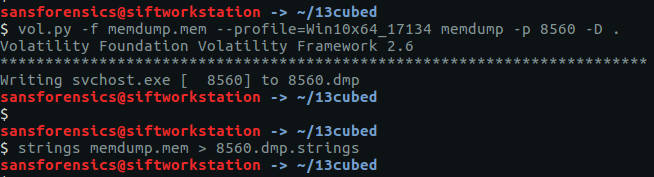
Find the running rogue (malicious) process and dump its memory to disk. You’ll find the 32 character flag within that process’s memory.
We start by dumping the memory of our rogue process to disk, and extracting the human-readable strings.
vol.py -f memdump.mem --profile=Win10x64_17134 memdump -p 8560 -D .
strings memdump.mem > 8560.dmp.strings
Easy so far. Unfortunately our output file contains almost 24 million lines (23,912,252 to be exact). We know the flag is 32 characters long, so let’s run strings again and specify that only lines with 32 characters or more should be extracted, then run those through sort and uniq to remove any duplicates.
strings -n 32 8560.dmp.strings | sort | uniq > 8560.dmp.strings.32
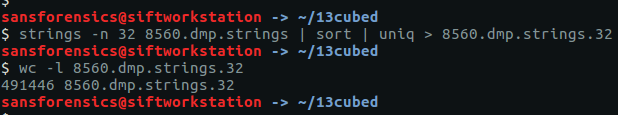
That’s a big reduction but still leaves 491,446 lines to search through. Sadly, with no idea what the flag looked like, I wasn’t able to find a more elegant way of filtering it out so resorted to paging through the file using less until I found something interesting.

"contents": "da391kdasdaadsssssss t.h.e. fl.ag.is. M2ExOTY5N2YyOTA5NWJjMjg5YTk2ZTQ1MDQ2Nzk2ODA=",
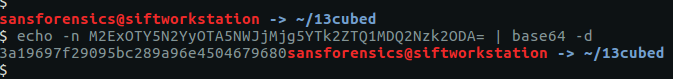
The last part of the string is longer than 32 characters, and looks like base64; let’s decode it and find the second flag.
echo -n M2ExOTY5N2YyOTA5NWJjMjg5YTk2ZTQ1MDQ2Nzk2ODA= | base64 -d
3a19697f29095bc289a96e4504679680
Flag 3
What is the MAC address of this machine’s default gateway? The flag is the MD5 hash of that MAC address in uppercase with dashes (-) as delimiters. Example: 01-00-A4-FB-AF-C2.
This question incorporates a bit of Windows host-based forensics knowledge. Details of the host’s network connections are held in the SOFTWARE registry hive, under the following key:
Microsoft\Windows NT\CurrentVersion\NetworkList\Signatures\Unmanaged
We can use Volatility to query the registry hives in memory using the printkey plugin; by default printkey will search through all available registry hives in the memory image, but we can be a bit more precise and use the hivelist plugin to find the address of the SOFTWARE hive rather than brute-forcing it.
vol.py -f memdump.mem --profile=Win10x64_17134 hivelist
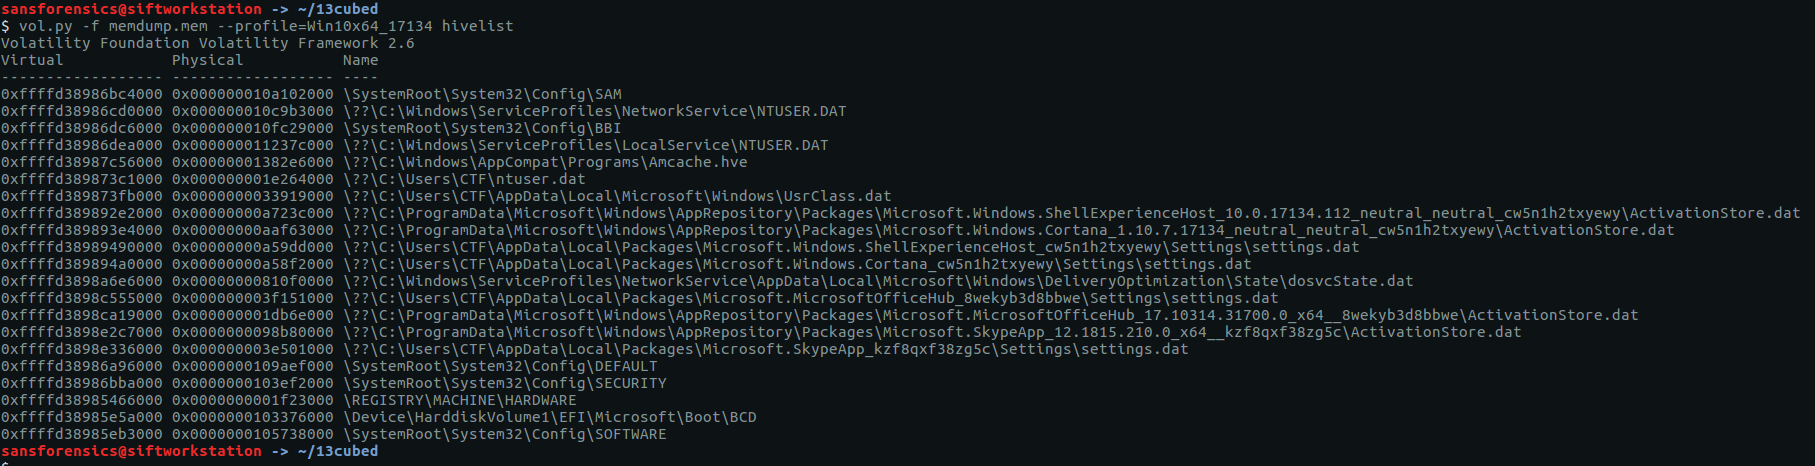
The hivelist plugin completes and tells us the virtual address of the SOFTWARE hive is 0xffffd38985eb3000. Now to use printkey to query the registry itself. The network data sits under a randomly generated sub-key; we will need to determine that before getting the data we are after.
vol.py -f memdump.mem --profile=Win10x64_17134 printkey -o "0xffffd38985eb3000" -K "Microsoft\Windows NT\CurrentVersion\NetworkList\Signatures\Unmanaged"
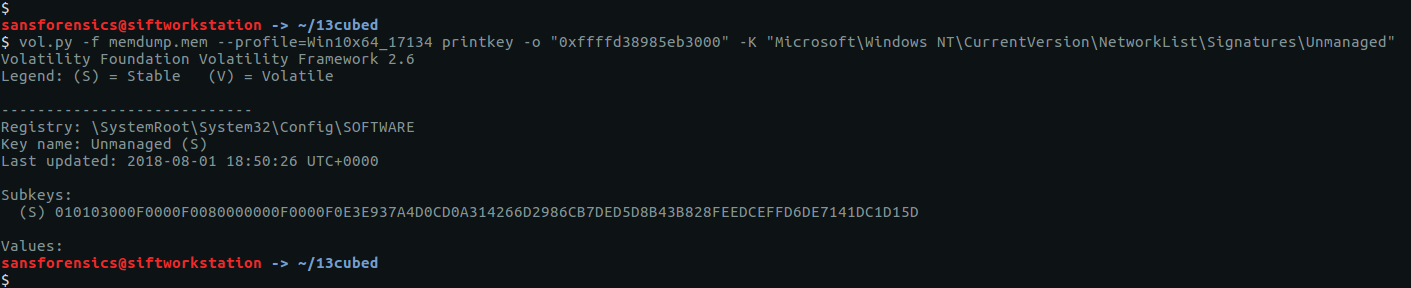
Luckily there is only one sub-key, making the task easier.
010103000F0000F0080000000F0000F0E3E937A4D0CD0A314266D2986CB7DED5D8B43B828FEEDCEFFD6DE7141DC1D15D
Running printkey again with our newly discovered path gives us our network data.
vol.py -f memdump.mem --profile=Win10x64_17134 printkey -o "0xffffd38985eb3000" -K "Microsoft\Windows NT\CurrentVersion\NetworkList\Signatures\Unmanaged\010103000F0000F0080000000F0000F0E3E937A4D0CD0A314266D2986CB7DED5D8B43B828FEEDCEFFD6DE7141DC1D15D"
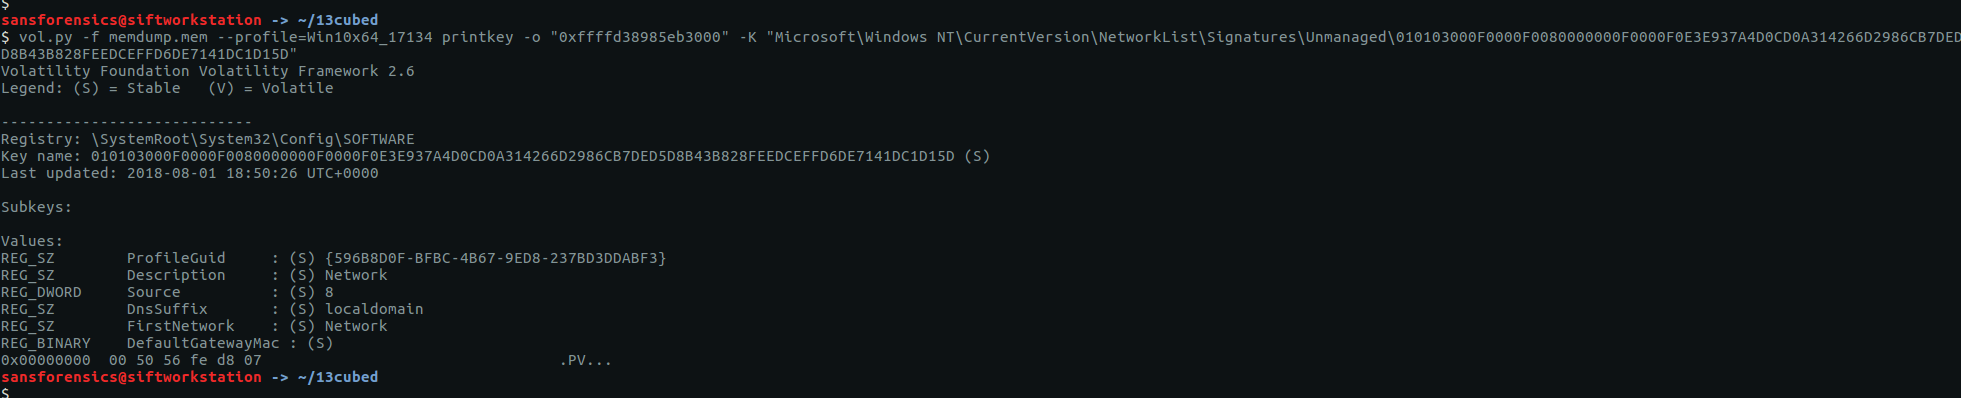
The MAC address of the default gateway is at the bottom of the output under DefaultGatewayMac. The question asks for the answer as the MD5 hash of the upper-case MAC address, with dashes as delimiters. Sounds like a task for CyberChef!
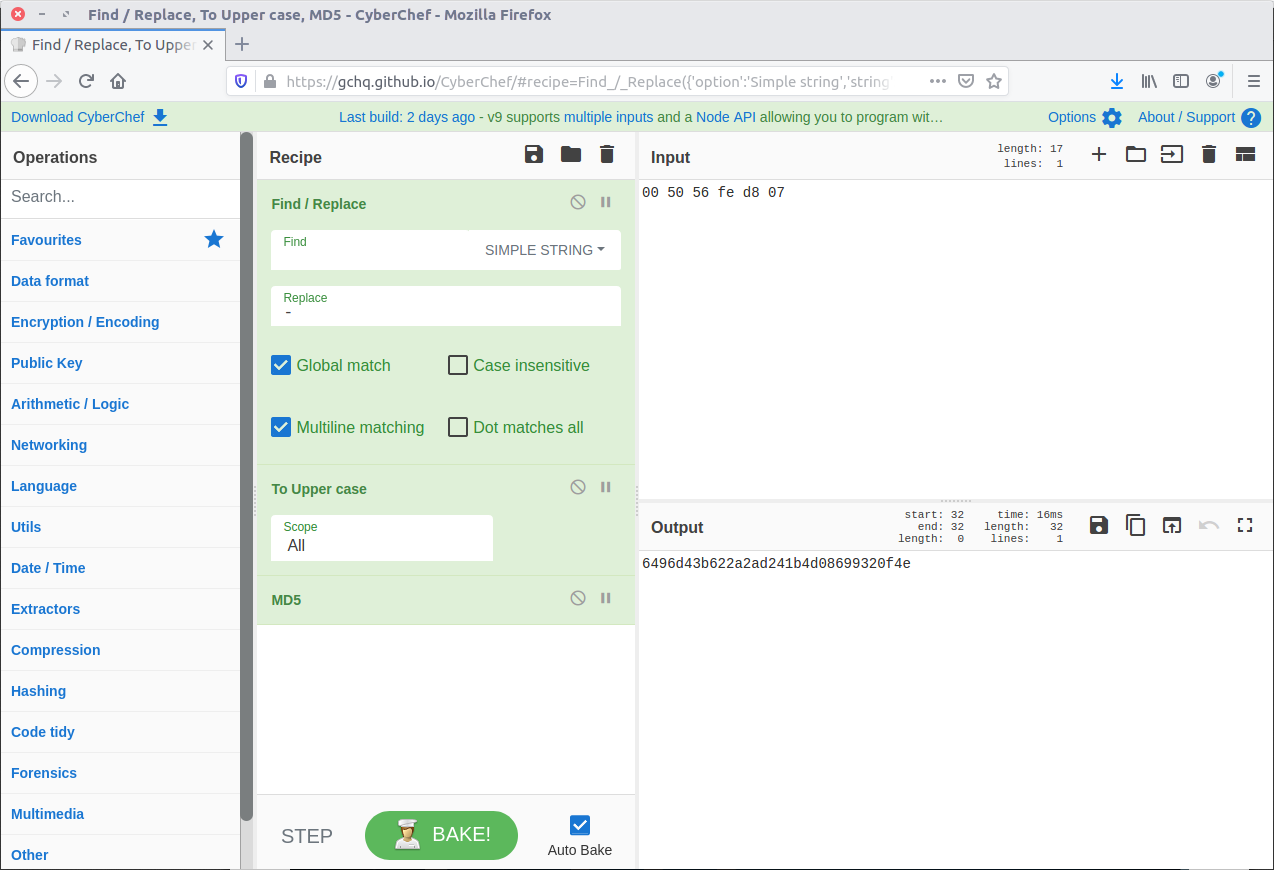
There we go. Flag three:
6496d43b622a2ad241b4d08699320f4e
Flag 4
Find the full path of the browser cache created when an analyst visited www.13cubed.com. The path will begin with “Users\.” Convert the path to uppercase. The flag is the MD5 hash of that string.
This one was relatively straightforward. We need to find a filepath created when www.13cubed.com was visited in a web browser. The question tells us that the path begins with “Users\” and we can assume that it contains the string “13cubed” as well. I first tried the filescan plugin to check for relevant file objects in memory, but this did not give me any meaningful results.
I tried again using the mftparser plugin which, perhaps obviously, parses the Master File Table combined with grep to filter on the string “13cubed”
vol.py -f memdump.mem --profile=Win10x64_17134 mftparser | grep -i "13cubed"
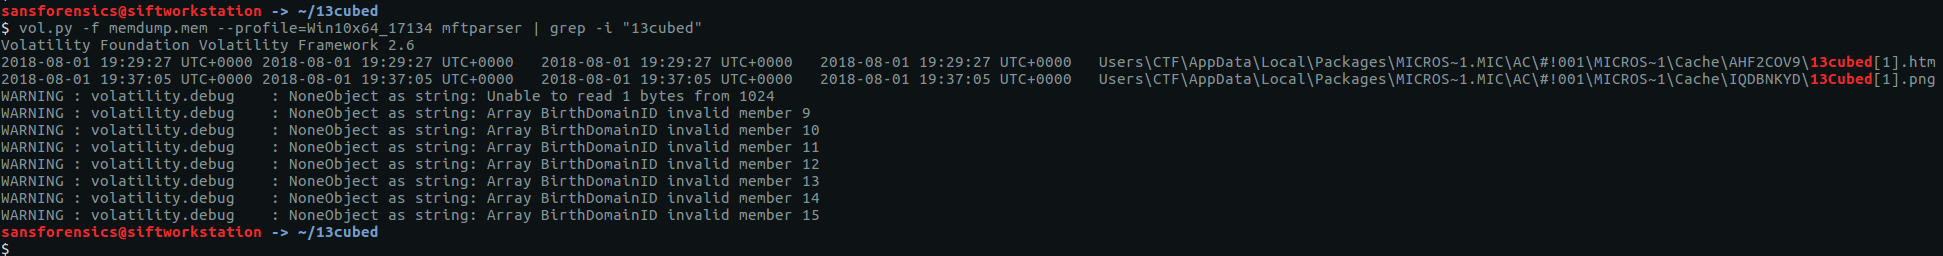
This gives two results, one HTML file and one PNG image. As we are looking for a web browser artefact I went with the path of the HTML file:
Users\CTF\AppData\Local\Packages\MICROS~1.MIC\AC\#!001\MICROS~1\Cache\AHF2COV9\13cubed[1].htm
We need to convert this to upper-case and calculate the MD5 hash to get the flag; back to CyberChef.
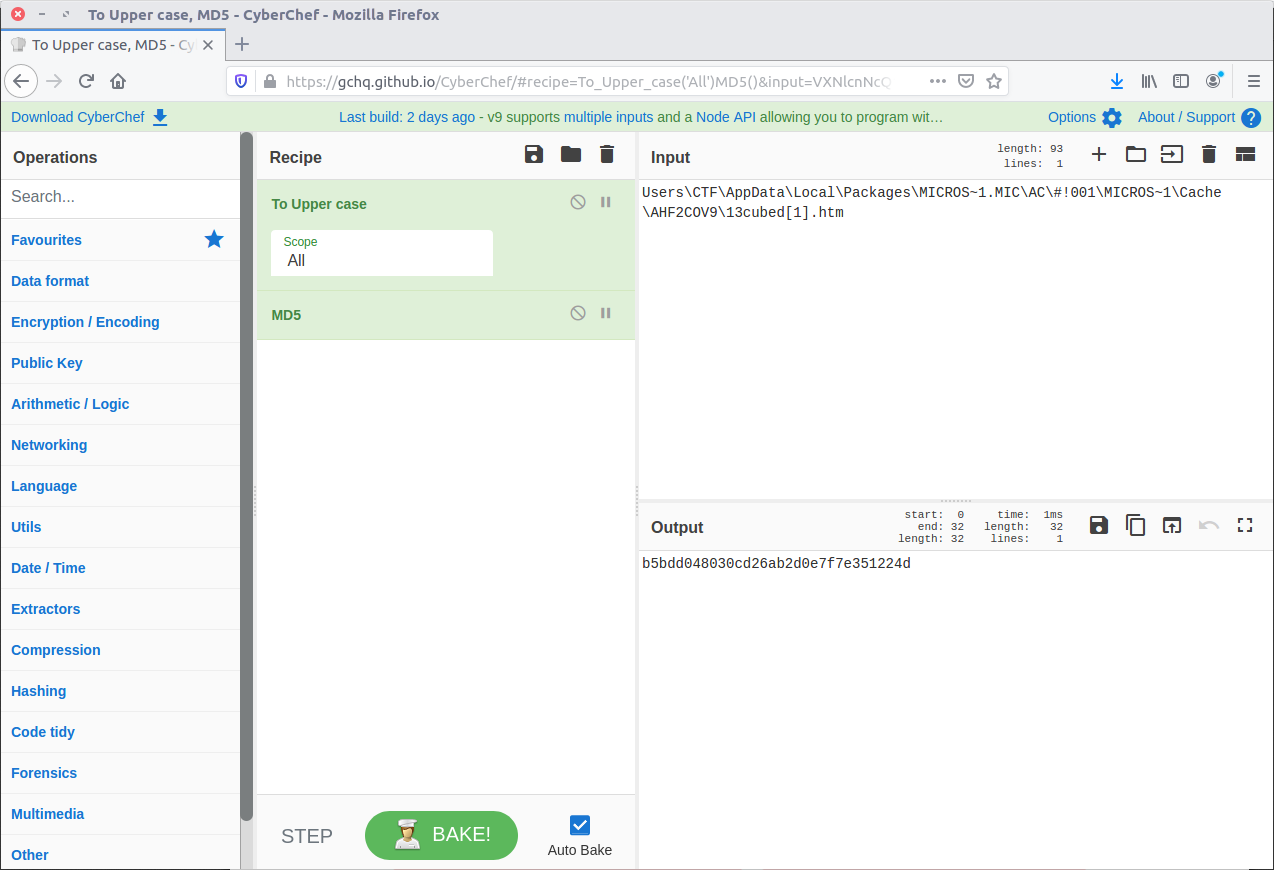
Final flag – done.
b5bdd048030cd26ab2d0e7f7e351224d
I didn’t win the Nintendo Switch but had a huge amount of fun working through the challenge, especially working on registry analysis via the memory image. I would encourage anyone reading this who wants to improve their forensics and incident response skills to subscribe to the 13Cubed Youtube channel, and I hope that Richard finds the time to put more challenges together in the future!
I know I’m slightly behind with this CTF but currently trying to brush up on my memory forensics!
I got a bit lost on your methodology on the 2nd question. You dumped the evil process so we could run it through nthe strings command to see if we can find anything of interest but then seem to send the whole memory dump to file so you end up with millions of lines (which are then filtered down).
If we were supposed to dump the evil process to analyse, what made you run this command
strings memdump.mem > 8560.dmp.strings
??
Is that not just human readable strings of the entire memory dump?
Great write up either way. Thank you